This Week In Veloren 85

This week, we have a new art blog by @Pfau. @xMAC94x goes into detail on how we measure networking statistics.
- AngelOnFira, TWiV Editor
Contributor Work
Thanks to this week's contributors, @xMAC94, @Sharp, @tylerlowrey, @Imbris, @Slipped, @TheThirdSpartan, and @mttmartin42!
@Pfau is back at the Veloren art blogs! You can check out No. 7 here. @Capucho is still trudging through the magic that in WGPU. @Awkor has been doing work on an inventory autosort proof of concept. @James is Working on new hotbar skill for the axe and a new m2 for the hammer (moving current m2 to the hotbar). @Sam is working on a sword overhaul.
@Songtronix wrote a discord bot (@Veloren) to control his testing server. It includes:
- Switching branches easily
- Querying the status of the server (updating, compiling) at any time
- Downloading the database
- Viewing server settings

Retouch of a repeating crossbow by @AlbinoAxolotl
Improved Server Metrics To Improve Server Performance by @xMAC94x
The first step of optimizing Veloren's server code is to know what runs the slowest. If we were to optimize less impactful areas, they wouldn't impact the end-user as much. We are using Prometheus metrics to gather data in real-time from our main server.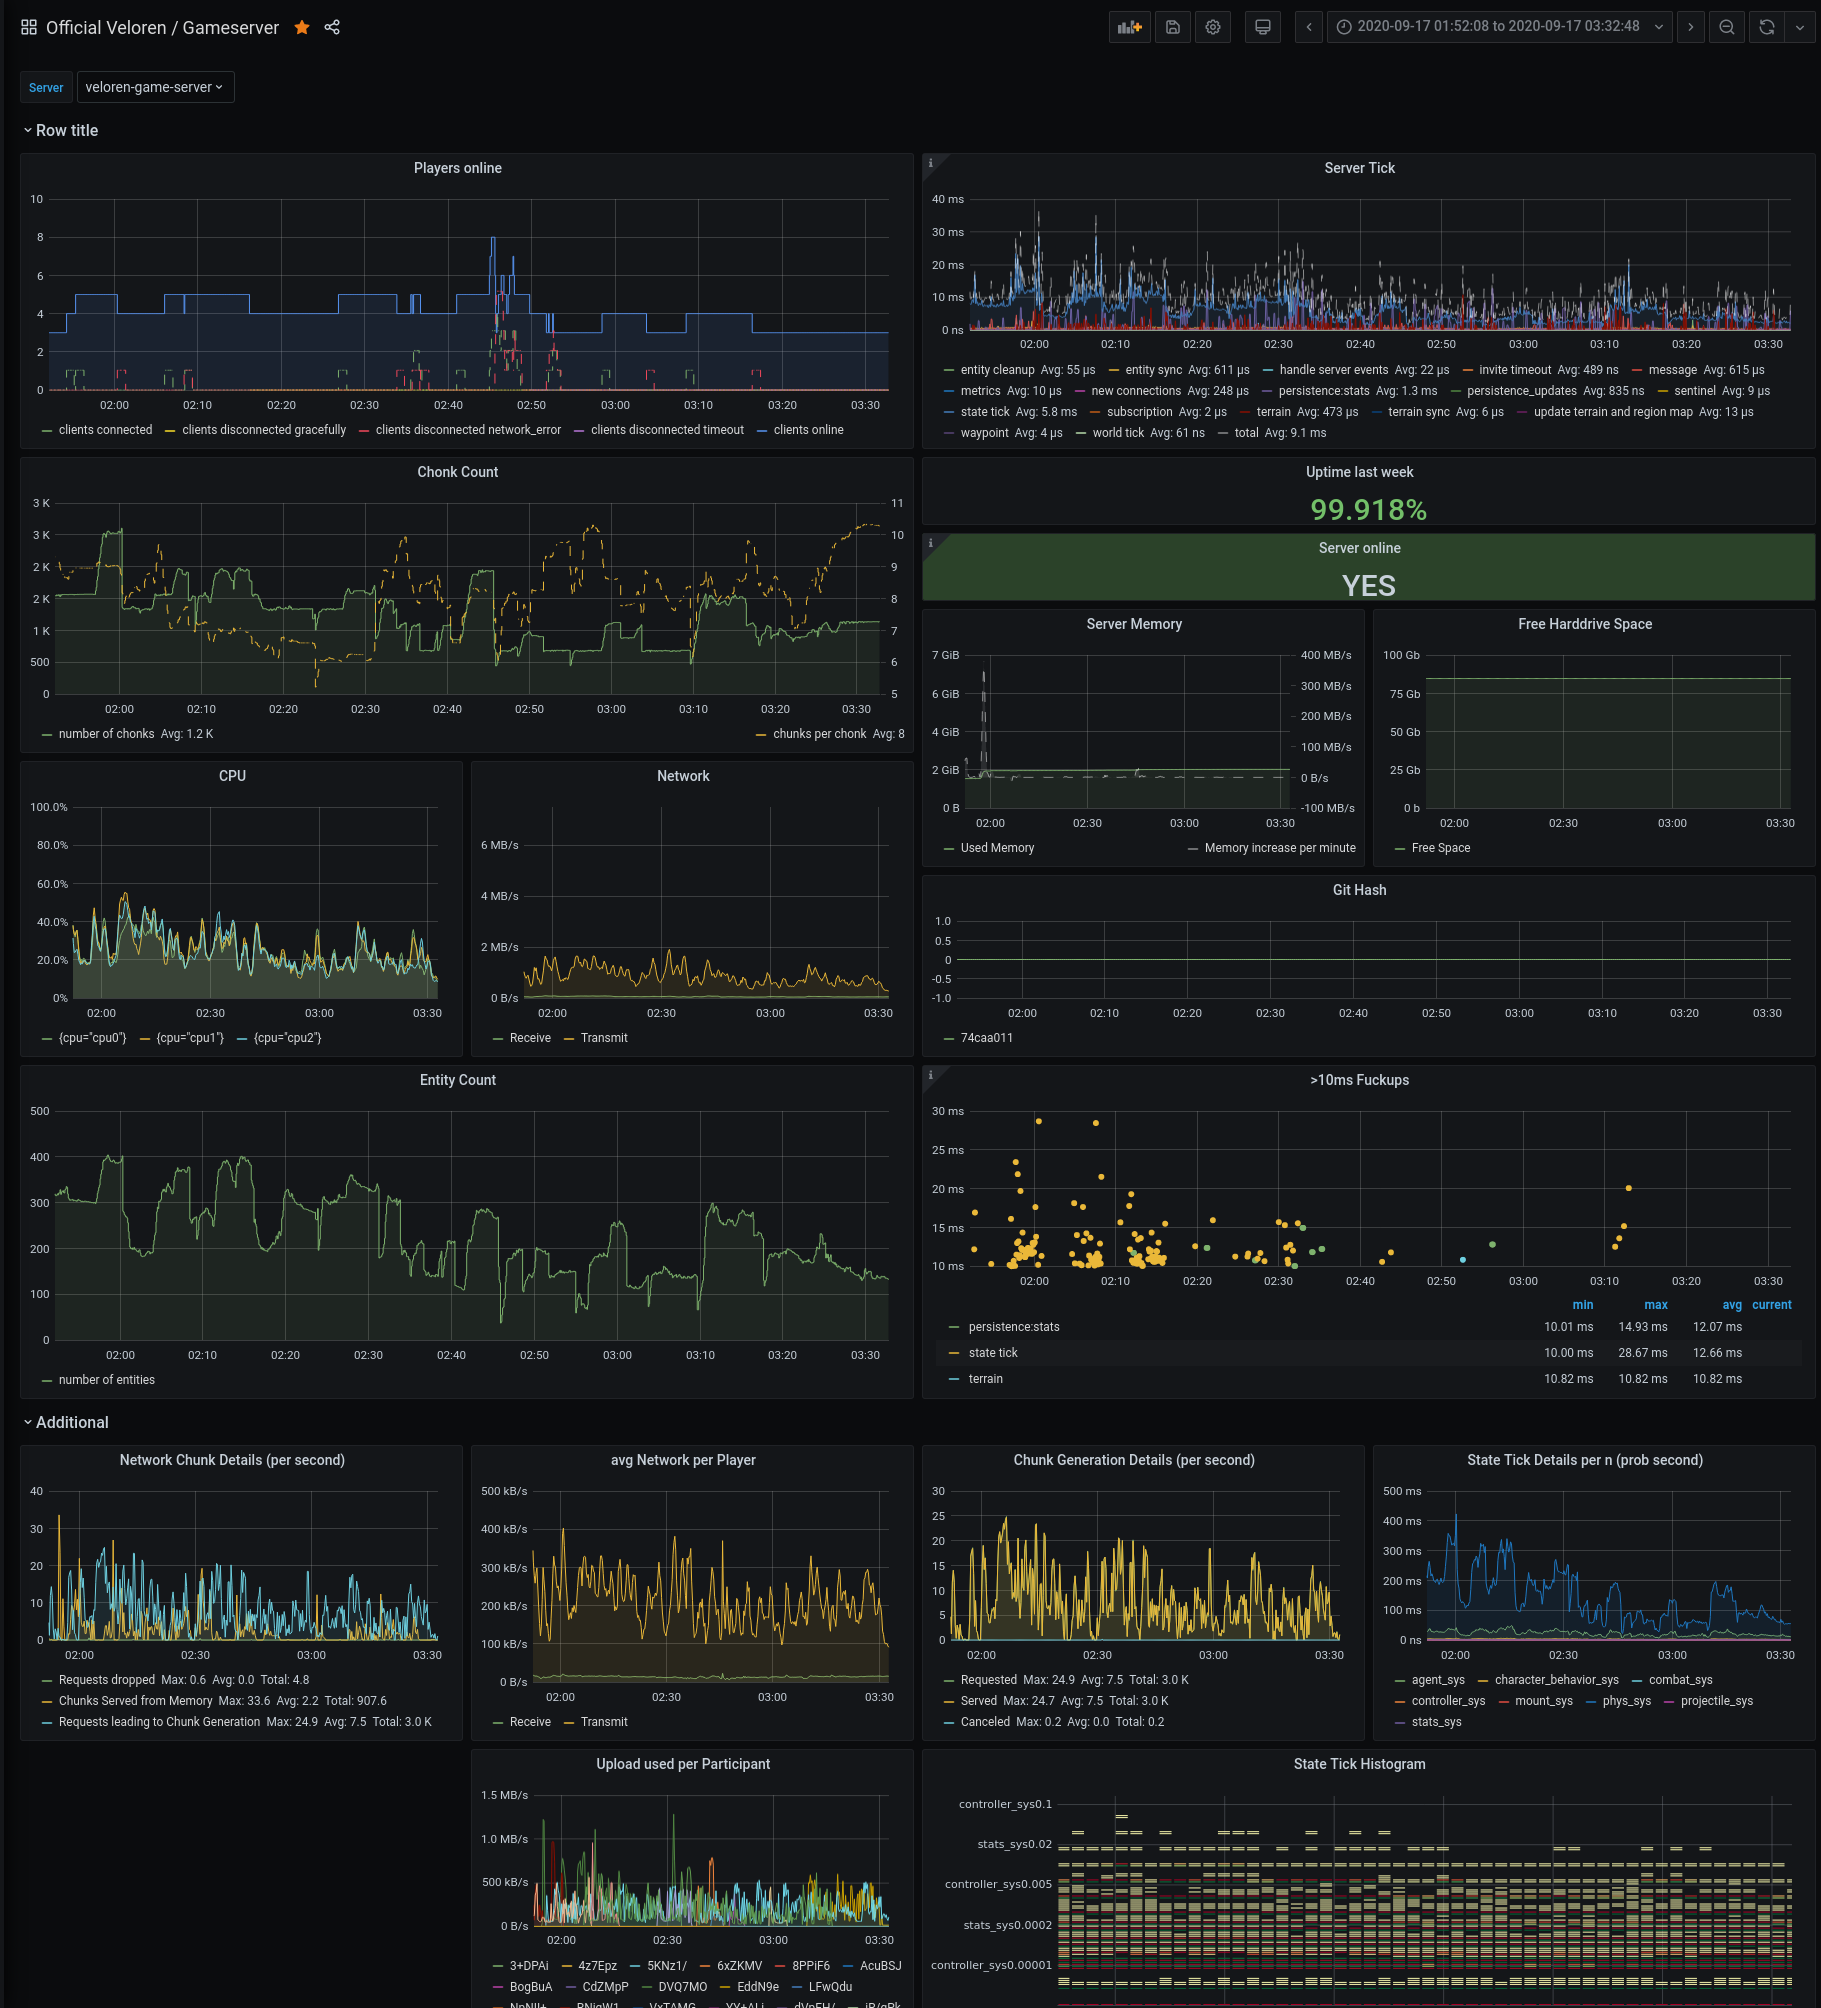
With some recent additions, we are now able to get the following metrics:
- Chunks requested from the server: every time a client asks for a chunk we will see how the server reacts. We can see if it need to compute the chunk or if it can just send a chunk which is already loaded because another player is already there.
- Chunk generation: when a chunk needs to be generated it is queued. This metrics will help us to see if this queue is getting bigger over time or if it remains at a healthy size.
- Active players: players online is now split into players connected and disconnected. This makes it easy to detect single events and even lets us detect when a client joins in the same time other leaves. The online players will be calculated with the difference. For disconnect, we now also track the event (i.e. Gracefully Close, Timeout, Network error). Though currently, under some conditions a network error is thrown for what is actually a graceful close.
- State timings: Even deeper look at our engine's
Statetimings. Before we only had a total time for our entire state. Now we can get the state timings based on each subsystem. It shows that physics likely needs the next optimisation.
Theory Of Continuous Prometheus Metrics
Metrics are generated every tick, but are actually only polled by the Prometheus server every 2 seconds. This means we only get a metric for every 60th tick. There are now multiple ways to handle this, especially in relation to timing data. Until now, we have always exported the last tick's timing. This meant we got 100% accurate timings on 1 out of 60 ticks, and no timing information on the remaining 59 ticks. We just had to assume that all the other 59 ticks are probably the same as this one tick. But we have no way of knowing if the tick we received was part of the 95th percentile, meaning much faster or slower than the rest. This information is important, as super slow ticks are the ones that cause lag.
Another way to tackle this problem is by summing up the timings. We can still poll the data every 2 seconds (60 ticks). So we get the total time spend for our all of these ticks, but aggregated together. However, just take the average and assume each tick was just 1/60 of that value. Or if there is a slow tick and 59 fast ticks, there is no way of knowing. A Steppesman's recurve bow by @AlbinoAxolotl
For this case, Prometheus has histograms. They provide buckets for different time ranges, lets say <1ms, 1-5ms, 5-10ms, >10ms. With Histograms, each tick will increase a number in its corresponding bucket. So if we have a super fast tick, it will increase the number in the <1ms bucket. if we have a super slow tick we increase the number in >10ms. We will be using a combination of BOTH. summing up all ticks AND histograms in the future to detect the average time we spend in a certain part of our code as well as make sure, that we don't have any spikes causing lags.
Altogether, these new techniques will allow us to get much better telemetry about the outliers. Often it's hard to make networking work well purely from what seems to be best in theory. Veloren's application is unique in many ways, and so we will have to keep striving to analyze how it runs from the data. Deer by the river. See you next week!