This Week In Veloren 87

This week lots of work has been done on Veloren infrastructure. @Sharp discusses some recent optimizations he made to chunk compression. @Sam talks about the current state of the healing sceptre.
- AngelOnFira, TWiV Editor
Contributor Work
Thanks to this week's contributors, @Sharp, @imbris, @XVar, @nwildner, @xMAC94x, @Slipped, @Snowram, and @zesterer!
A stress test party was held last weekend to test how the game server would work with limited resources. We gathered a lot of data from a few different crashes. @Sharp worked on some massive improvements to how we store chunks, resulting in ~7x in chunk memory. @lobster worked on adding SFX and particles for leveling up, death, and voxel destruction. @Sam worked on a sceptre rework.
@xMACx and @AngelOnFira have been working on big changes to the Veloren server infrastructure. This included getting the main game server into a datacenter, as well as exploring technologies that will help us scale our services in the future. They have also been re-examining CI to see where potential improvements could be made. @xMAC94x and @AngelOnFira hard at work this week on cloud infrastructure for Veloren
Sceptre Rework by @Sam
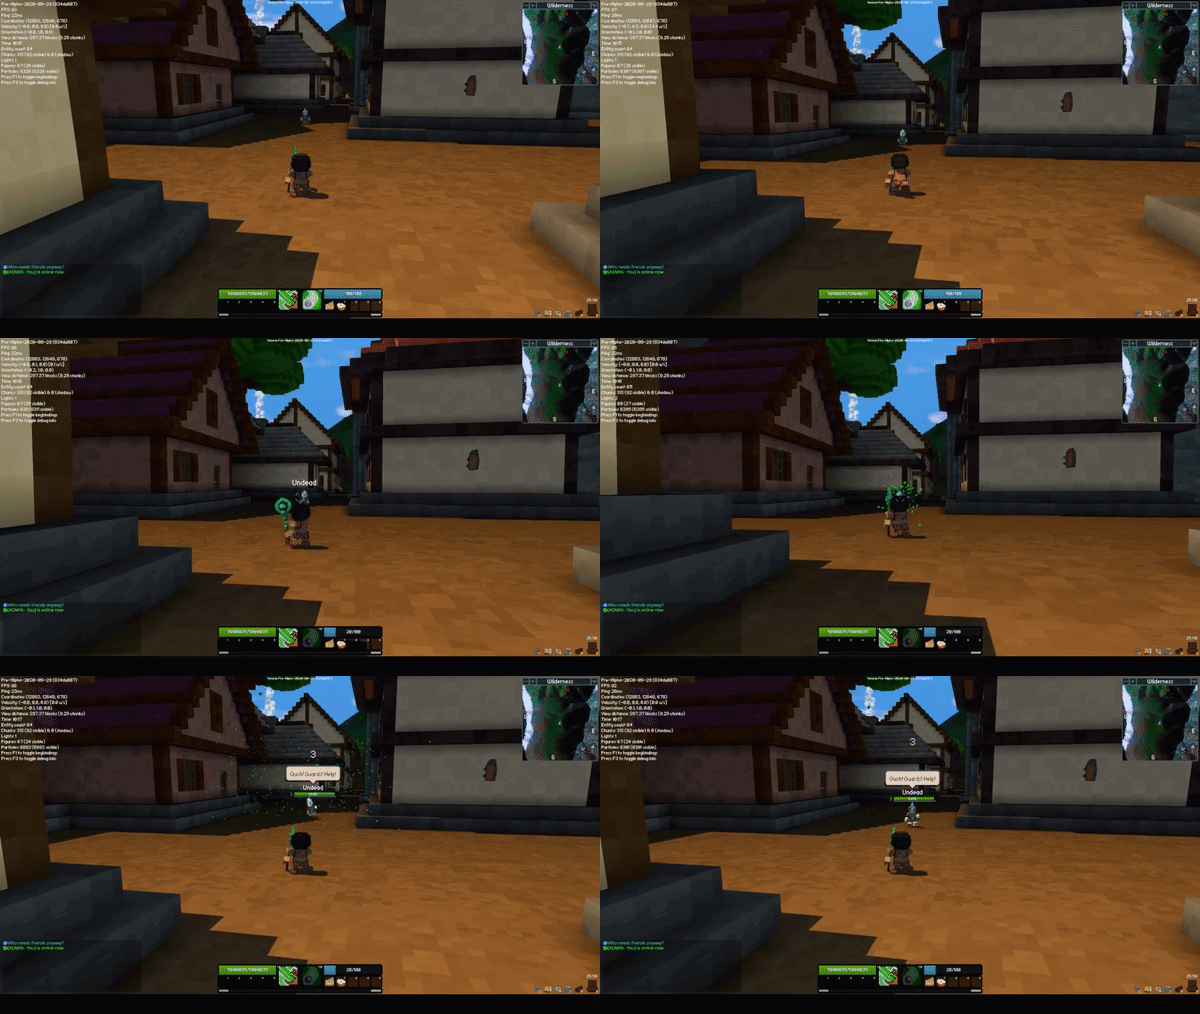
The sceptre rework completely changes how both abilities on the sceptre function. The new M1 skill is a beam, and while active, it hits all entities within the beam two times per second. When an enemy is hit, they take damage, and you gain energy and a bit of health. When an ally is hit, they are healed but it costs energy.
The new M2 skill is an explosive projectile. Similar to the M1, it both damages enemies and heals allies. The projectile functions similarly to the current 1st ability on the staff, however it has gravity and slower projectile speed.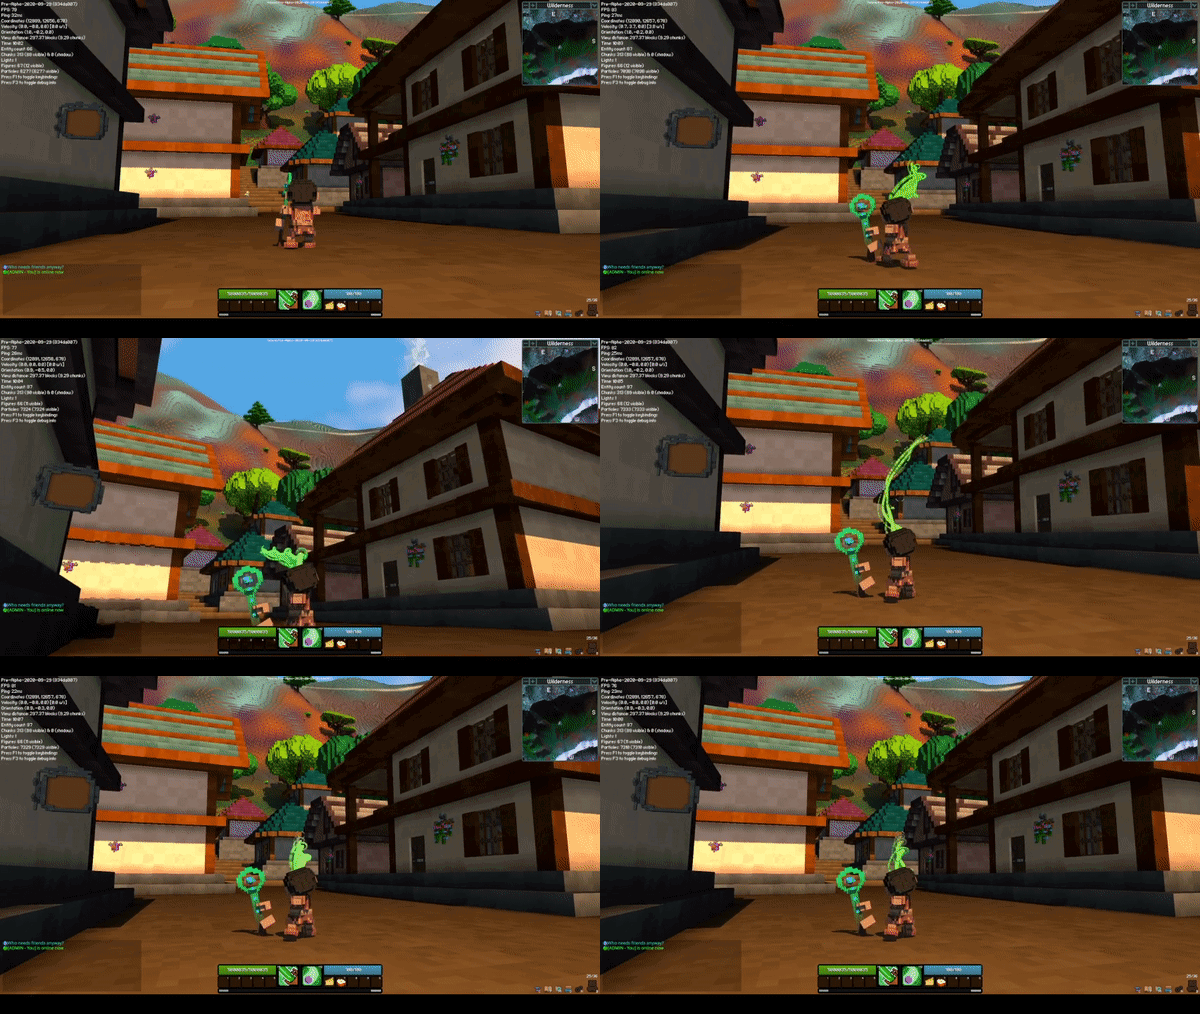
Memory Optimizations by @Sharp
This week, I fixed some bugs in worldgen that saw a huge (~7x) reduction in chunk memory. This should hopefully reduce crashes due to Out Of Memory (OOM) when people have high view distances. The underlying cause for the order of magnitude blowup was that we were not choosing the "default" block type effectively for most chunks, resulting in lots of extra space used for completely identical blocks even though the format supports compressing these a lot.
So my change was to explicitly find the highest frequency compressible block in each subchonk and use that as the default, after chunk generation is done. Which resulted in the big win. There is still more to do there, but this is a good start.
Realistically, I think we should have swap enabled. We need to be able to handle situations where our estimates on average chunk size were off. Swap would allow us to mitigate OOM crashes. This is because we can't really predict an upper bound to chunk memory usage it right now.
That doesn't mean we're going to stop improving memory usage. The fix I made was low hanging fruit, but it's hard to notice if you don't start from a root cause analysis like "how much do memory do I think chunks should take?". Then you can look at the metrics and see if there is a large discrepancy. Otherwise, it's hard to say how much space chunks "should" take up. Which is kinda the issue here.
There are lots of potential areas where we could find large speedups. What I'm trying to do right now is simplify and disentangle all the different systems we have running. That way, we know how they're scheduled and they aren't interfering with each other. Then we can get clean benchmarks and actually understand how much time each system is consuming and how it scales.
Right now a lot of the CPU metrics are just hard to interpret because of how much interference there is between different systems. We know physics shows up high in the profiler, but when @imbris profiled it separately, its scheduling pattern didn't make any sense in isolation. So that means there's stuff going on we don't understand.
Disentangling isn't about improving measurement tactics, but rather rearranging how our systems run so we have better control over the resources involved. This includes spawning fewer threads, using precise worker pools, pinning to cores, etc. Also, simplifying protocols that involve communication or synchronization between systems. This can lead to nondeterminism that is difficult to diagnose. Solutions for this include fewer channels, queues, and mutexes. We also need more deterministic communication (function calls or fork/join parallelism), and much more tightly controlled I/O.
For all of this, there isn't one simple thing we have to do. However, here are some paths that can be taken:
- Making better use of the ECS
- Explicitly controlling worker pools (rather than using globals)
- Moving to libraries that don't spawn pools behind our backs
- Passing config parameters from server and client start so the application can be aware of how many resources it's supposed to take up
- Splitting up all our tasks into logical sets
- Replacing synchronous with asynchronous I/O in networking contexts
- Separating out systems that don't need to block the game server from systems that do
Again, these options will help to disentangle systems and make it easier to isolate specific issues. Memory is a lot easier to analyze for issues like this, except for some stuff like fragmentation or overcommit. This is because it's often pretty tightly bound to whatever requests the memory, at least in Rust with strict ownership. So it's "easy" to reason about those resources even in a very tangled up app, in Rust. But no such guarantees exist for CPU or I/O resources, or for contended access to memory. Well, we already knew chunks were using a lot of RAM. What we didn't know is how much they were supposed to be using. Which isn't something Valgrind or any other automated tool can necessarily tell you.
Unfortunately, there are so many factors that can affect runtime performance, that I don't think metrics alone are going to help resolve CPU and I/O issues. At best they can vaguely point us to areas of the app (like physics) that look slow, but they won't tell us why.
There are indicators that could tell us that there was jitter in areas like page faults, instruction throughput, and memory bandwidth. But since we already know all that stuff is contended I don't think it would reveal too much useful information to us right now. It's like science, you have to have an actual hypothesis first if you want to gain real knowledge from metrics.
Right now we have no hypothesis for how long systems like physics should be taking except for "not that long". So it's hard to say what part is surprising. And then there are other times we measure that seem short... are they realistically short? Are we even measuring them correctly? It's really hard to say, especially with so many threads being assigned to the same core. Hence, disentangling is currently the best path forward.
