This Week In Veloren 93

This week, we hear from @xMAC94x about analyzing performance issues in Veloren, as well as how we have fixed it in preparation for the 0.8 release. We also present the 0.8 release schedule, and the important times to join in on the server.
- AngelOnFira, TWiV Editor
Contributor Work
Thanks to this week's contributors, @Slipped, @zesterer, @xMAAC94x, @Sam, @James, @cpetig, @imbris, @AlKabir, @TheBoredProgrammer64, @Snowram, @Pfau, and @Ubruntu!
The monthly Rust Gamedev newsletter for October was released! @zesterer worked on removing legacy code, speeding up terrain generation, and improving tree spawning and deserts. @Ubruntu and @James worked on improving sneaking and rolling so that you can get closer to enemies before being detected.
@Christof completed waypoint persistence. Now, the last waypoint is the player's starting point. @Sam did some work on the backend that caused some bugs, and fixed some bugs. @AngelOnFira recorded the Veloren talk for MiniDebConf, which is coming up on the 22nd.
0.8 is scheduled to release on the 28th of November. There will be pre-release testing on the server at 18:00 GMT+0 on the 25th and 26th, and the full release party will take place at 18:00 GMT+0 on the 28th! Here is the release schedule:
2020-11-24 18:00:00 GMT+0 Feature freeze - At this point no features will be merged.
2020-11-25 18:00:00 GMT+0 Public Stability Testing with many people
2020-11-26 18:00:00 GMT+0 NEW - relaxed 0.7 throwback event
2020-11-27 18:00:00 GMT+0 Fixes freeze - Nothing will be merged except gamebreaking fixes
2020-11-28 09:00:00 GMT+0 Final Build
2020-11-28 12:00:00 GMT+0 Prepare a Release Server
2020-11-28 18:00:00 GMT+0 Release Party
Performance Analysis with @xMAC94x
I wrote a couple of articles this week. They reflect on how we've been doing with server performance, especially during releases.
Analysis Tools
Prometheus is a monitoring tool that I've talked about quite often. It runs in the background with every veloren-server (even when you host it yourself). It theoretically allows for a Prometheus/Grafana server to attach to it, as long as you set up port forwarding.
You can gather real-time statistics about the CPU or hard drive usage of your server. We also included Veloren info:
- number of players connected
- number of chunks loaded
- number of entities
- incoming chunk requests
- detailed network stats per player
- server tick time
The fact that it's always running with almost no performance hit allows us to perform analysis anytime, especially during events like the release party. Those big events have unusual constellations (e.g. many players) that developers don't see when introducing a feature. Bigger events are the perfect occasion to see if your code scales.
Tracy is an awesome performance analyser that got included in Veloren by @imbris and is even mentioned in our book.
You can compile the Veloren server with Tracy support and you will get an executable that you can attach the Tracy GUI to. It records server ticks and their respective timing. It can tell us how many milliseconds we spend in which function and even better you can define spans in the code and it will be even more detailed. Tracy even has GPU and memory measurement features, although I haven't used them so far.
Release Party Statistics
Our high score of concurrent players on the server at a release party so far was 53. However, the server is still far away from its full potential. We released the Prometheus stats from 0.7 release party in a previous blog post. As you can see, it includes the averages of our server tick. Veloren uses a 30 tick server, so we do 30 ticks per second. Since Prometheus metrics from 0.7 release party1s/30 = 33.3ms, 33ms is our time budget per tick. The server can spend it on multiple tasks such as handling messages, generating terrain, and calculating physics. However, if the server did not finish within 33ms we are running behind. We are becoming laggy. For the release party the average was around 280ms...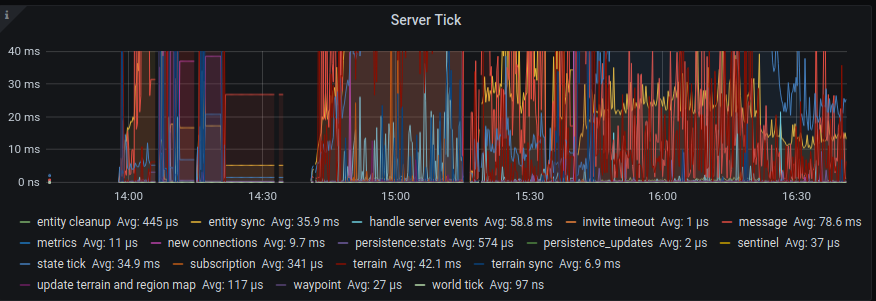
So we need to make improvements! These are the detailed tick times:
- message handling: 80ms
- handle server events: 60ms
- terrain: 42ms
- state tick: 35ms
- entity sync: 35ms
- new connections: 10ms
- terrain sync: 7ms
Since the 0.7 release, we improved message handling by a large factor. Though it still can be parallelized. We estimate that we've cut the time in half. Handle server events probably wasn't updated and is still quite a bottleneck. As those events are handled in a single thread, we need to find a better way to scale here.
There was a recent change by @zesterer which sped up terrain generation by more than 100%. The state tick includes the physics simulation, which is quite slow. It can probably reduce down to 10ms. New connections are no longer handled at all as part of the active game loop, they are handled in a separate thread. This allows longer TCP disconnects to not cause issues.
Next week I will write in-depth about what was wrong with physics and how to make use of our new network backend. I will also use more images, promised :)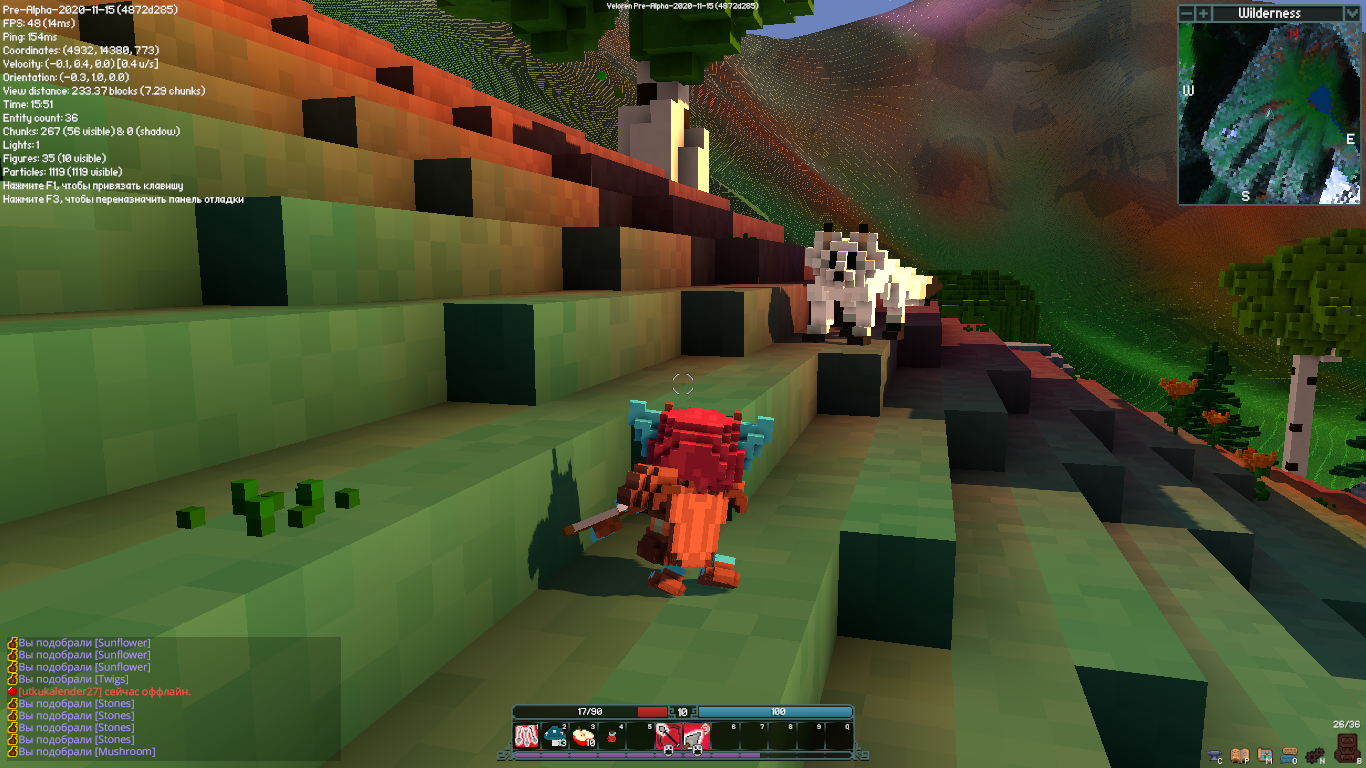
Smoother Frames
Let's leave the performance optimisations and talk about scheduling. Scheduling is crucial for every game because you have to define exactly when to render a frame or do physics calculation. If your pattern is irregular, the perceived framerate is much lower and users notice lag.
Therefore every game has a Clock. The clock tries to keep the framerate constant, e.g. at 60 FPS for voxygen or 30 FPS for the server. If a tick is a bit slower the clock will sleep for a short time to smoothen out the curve.
Until now we used a clock that tried to compromise for slow ticks, it tried to calculate the average speed and sleep so long that we reach our framerate. The problem with that algorithm is when spikes occur. You can see below that after a lag spike, there are heavy fluctuations. Ignore the timing on the image, it refers to something else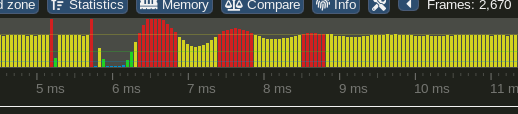
We see a gigantic lag spike at the beginning (2nd large red spike) which takes over 200ms. To compensate the server tries to make 10 faster ticks. Now the tick time is too fast and the server slows down. It makes 10 slower ticks. After 60 ticks we are back to normal. The whole wave took 2s and is noticeable by the user.
So what can we improve? First of all, we need to get rid of the lag spike in general. That would be ideal, but is not always possible. So we have to find a better way of handling them. Imaging we just had a lag spike, what should the server do next? Or a better question; imagine you just froze for 2 seconds, what is the best thing to do now? Does it help when the server speeds up for 300 ms? No, the server should just continue normally, and smoothly. We want to get rid of the ripple through the tick times and get back to a stable tick ASAP. New clock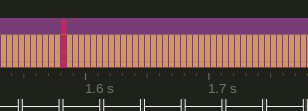
The new algorithm simply tries to keep the tick time constant. It can't prevent the lag, but it also can't help. It just goes back to work.
Additionally, we now use a feature suggested by @imbris. Imagine our calculations for a tick took 9ms, we want our full tick to take 33ms, so we need to sleep for 24ms. Till now, we told the operating system: wake me up in at least 24ms. This could mean we were woken up after the 24ms, resulting in small imperfections of the tick time. Our new approach is, to only sleep for 23.8ms and actively waiting the last 0.2ms. This takes almost no performance, as the waiting time is so short (0.2ms), but it greatly stabilizes our tick time to 33ms.
I hope you not only notice these effects on the server, but also with your frames being delivered (just a bit) more smoothly than before :) Campfire at night. See you next week!